Getting Started
Overview
This document provides a getting started guide for building topology from OpenTelemetry (OTel) trace data using component and relation mappings packaged as part of a StackPack.
This guide focuses on topology that can be visualized immediately in the product using telemetry data that is already present. The example topology that will be generated models how a service instance executes a process, derived from OpenTelemetry resource attributes.
Prerequisites
-
You already collect OpenTelemetry traces.
-
You are creating or extending a StackPack.
-
You are comfortable with YAML and basic OTel concepts (resources, spans).
The guide will focus on:
-
Trace-based topology (
TRACESsignal only) -
Service instances (not logical services)
-
Runtime process visibility
|
In this guide, component and relation mappings are expressed as YAML configuration that is packaged, tested, and deployed as part of a StackPack. |
Configuring topology
The goal is to visualize runtime execution topology that is immediately available without additional user configuration.
Specifically, we want to model:
service instance (component) -> executes (relation) -> process (component)Where:
-
A
service instancerepresents a running instance of an instrumented service. -
A
processrepresents the operating system process executing that service. -
The
executesrelation indicates that the service instance is backed by, and running within, a specific process.
All of this topology is derived automatically from OpenTelemetry trace data.
Trace data
In addition to service identity, the trace resource includes process-level attributes such as:
-
process.pid -
process.executable.name -
process.executable.path -
process.command_args -
process.runtime.name -
process.runtime.version
These attributes allow us to model process-level topology without span correlation or heuristics.
Traces to topology: the mental model
Before writing any configuration, it’s important to understand how topology mappings work conceptually.
Components
A component mapping describes how a topology node is created from telemetry data.
Each component mapping:
-
Selects telemetry using conditions.
-
Extracts values using expressions.
-
Produces a single logical component identified by a stable identifier.
In this guide:
-
Service instances are provided by the OpenTelemetry StackPack.
-
Processes are derived from OpenTelemetry resource attributes.
Service instance components
Service instance components are already defined and provided by the OpenTelemetry StackPack.
Each service instance:
-
Is derived from
service.name,service.namespace, andservice.instance.id. -
Represents a concrete running instance of a service.
-
Is stable across signals (traces and metrics).
Because this mapping already exists, it is not redefined in this guide. Instead, we build on top of it.
Creating process components from traces
Defining what a "process" means
For this guide, a process is defined as:
-
Identified by
host.name,process.pidand executable metadata. -
Scoped to a single runtime environment.
-
Derived exclusively from OpenTelemetry resource attributes.
This keeps the topology low-cardinality while still exposing useful runtime detail.
Process component mapping
The following component mapping creates one topology component per observed process.
_type: "OtelComponentMapping"
name: "OTel Process"
description: "Represents an operating system process derived from OpenTelemetry"
identifier: "urn:stackpack:<stackpack-name>:shared:otel-component-mapping:process"
input:
  signal:
    - "TRACES"
  resource:
    condition: |
      'host.name' in resource.attributes &&
      'process.pid' in resource.attributes
    action: "CREATE"
vars:
  - name: "pid"
    value: "${string(int(resource.attributes['process.pid']))}"
  - name: "hostname"
    value: "${resource.attributes['host.name']}"
  - name: "executableName"
    value: >-
      ${
        'process.executable.name' in resource.attributes ?
         resource.attributes['process.executable.name'] :
          'process.command' in resource.attributes ?
           resource.attributes['process.command'] :
            'process.command_args' in resource.attributes ?
             resource.attributes['process.command_args'] :
                resource.attributes['process.executable.path']
      }
output:
  identifier: "urn:opentelemetry:process/${vars.hostname}:${vars.pid}"
  name: "${vars.hostname}/${vars.executableName}:${vars.pid}"
  typeName: "process"
  typeIdentifier: "urn:stackpack:open-telemetry:shared:component-type:process"
  layerName: "Applications"
  domainName: "Open Telemetry"
  required:
    tags:
      - source: "process-component"
        target: "custom"
      - source: "${resource.attributes}"
        pattern: "process.(.*)"
        target: "process.${1}"
expireAfter: 900000
How this mapping works
-
We process trace data only (TRACES signal).
-
A process component is created whenever
host.nameandprocess.pidis present. -
The identifier is stable for the lifetime of the process.
-
A custom tag is added to aid filtering (for the verification stage).
Substitute <stackpack-name> with the name of your StackPack.
Creating executes relations
Now that service instances and processes exist as components, we can connect them.
Service instance executes process
The following relation mapping creates an executes relation from a service instance to a process.
This mapping is adapted from the existing "host executes service instance" relation provided by the OpenTelemetry StackPack.
_type: "OtelRelationMapping"
name: "Executes Relation (Service Instance -> Process)"
description: "Service instance executes a process"
identifier: "urn:stackpack:<stackpack-name>:shared:otel-relation-mapping:executes-service-instance"
input:
  signal:
    - "TRACES"
  resource:
    condition: |
      'service.name' in resource.attributes &&
      'host.name' in resource.attributes &&
      'process.pid' in resource.attributes
    action: "CREATE"
vars:
  - name: "namespace"
    value: "${'service.namespace' in resource.attributes && resource.attributes['service.namespace'] != '' ? resource.attributes['service.namespace'] : 'default'}"
  - name: "service"
    value: "${resource.attributes['service.name']}"
  - name: "instanceId"
    value: >-
      ${
        'service.instance.id' in resource.attributes && resource.attributes['service.instance.id'] != '' ?
        resource.attributes['service.instance.id'] :
        resource.attributes['service.name']
      }
  - name: "hostname"
    value: "${resource.attributes['host.name']}"
  - name: "pid"
    value: "${string(int(resource.attributes['process.pid']))}"
output:
  sourceId: "urn:opentelemetry:namespace/${vars.namespace}:service/${vars.service}:serviceInstance/${vars.instanceId}"
  targetId: "urn:opentelemetry:process/${vars.hostname}:${vars.pid}"
  typeName: "executes"
expireAfter: 900000
How this mapping works
-
We process trace data only (
TRACESsignal). -
The relation is created whenever both service instance and process data are present.
-
No span correlation is required.
-
The
targetIdexpression needs to be the same as the process component mapping’soutput.identifierexpression.
The relation identifier is constructed (automatically) from the sourceId and targetId, and is of the form: sourceId-relationId
Substitute <stackpack-name> with the name of your StackPack.
Validating the OTel mappings
Assuming both mappings live inside your StackPack, they can be tested together. Refer to StackPack CLI documentation for more information.
Using the sts stackpack test --yes command, you can:
-
Package, upload, and install/upgrade the StackPack
-
Validate the declarative component and relation mappings residing in the StackPack (e.g., expression correctness, correct reference of input signal data based on filtering provided)
|
The |
Resulting topology
When these mappings are applied, the resulting topology forms a service-process graph derived entirely from trace data.
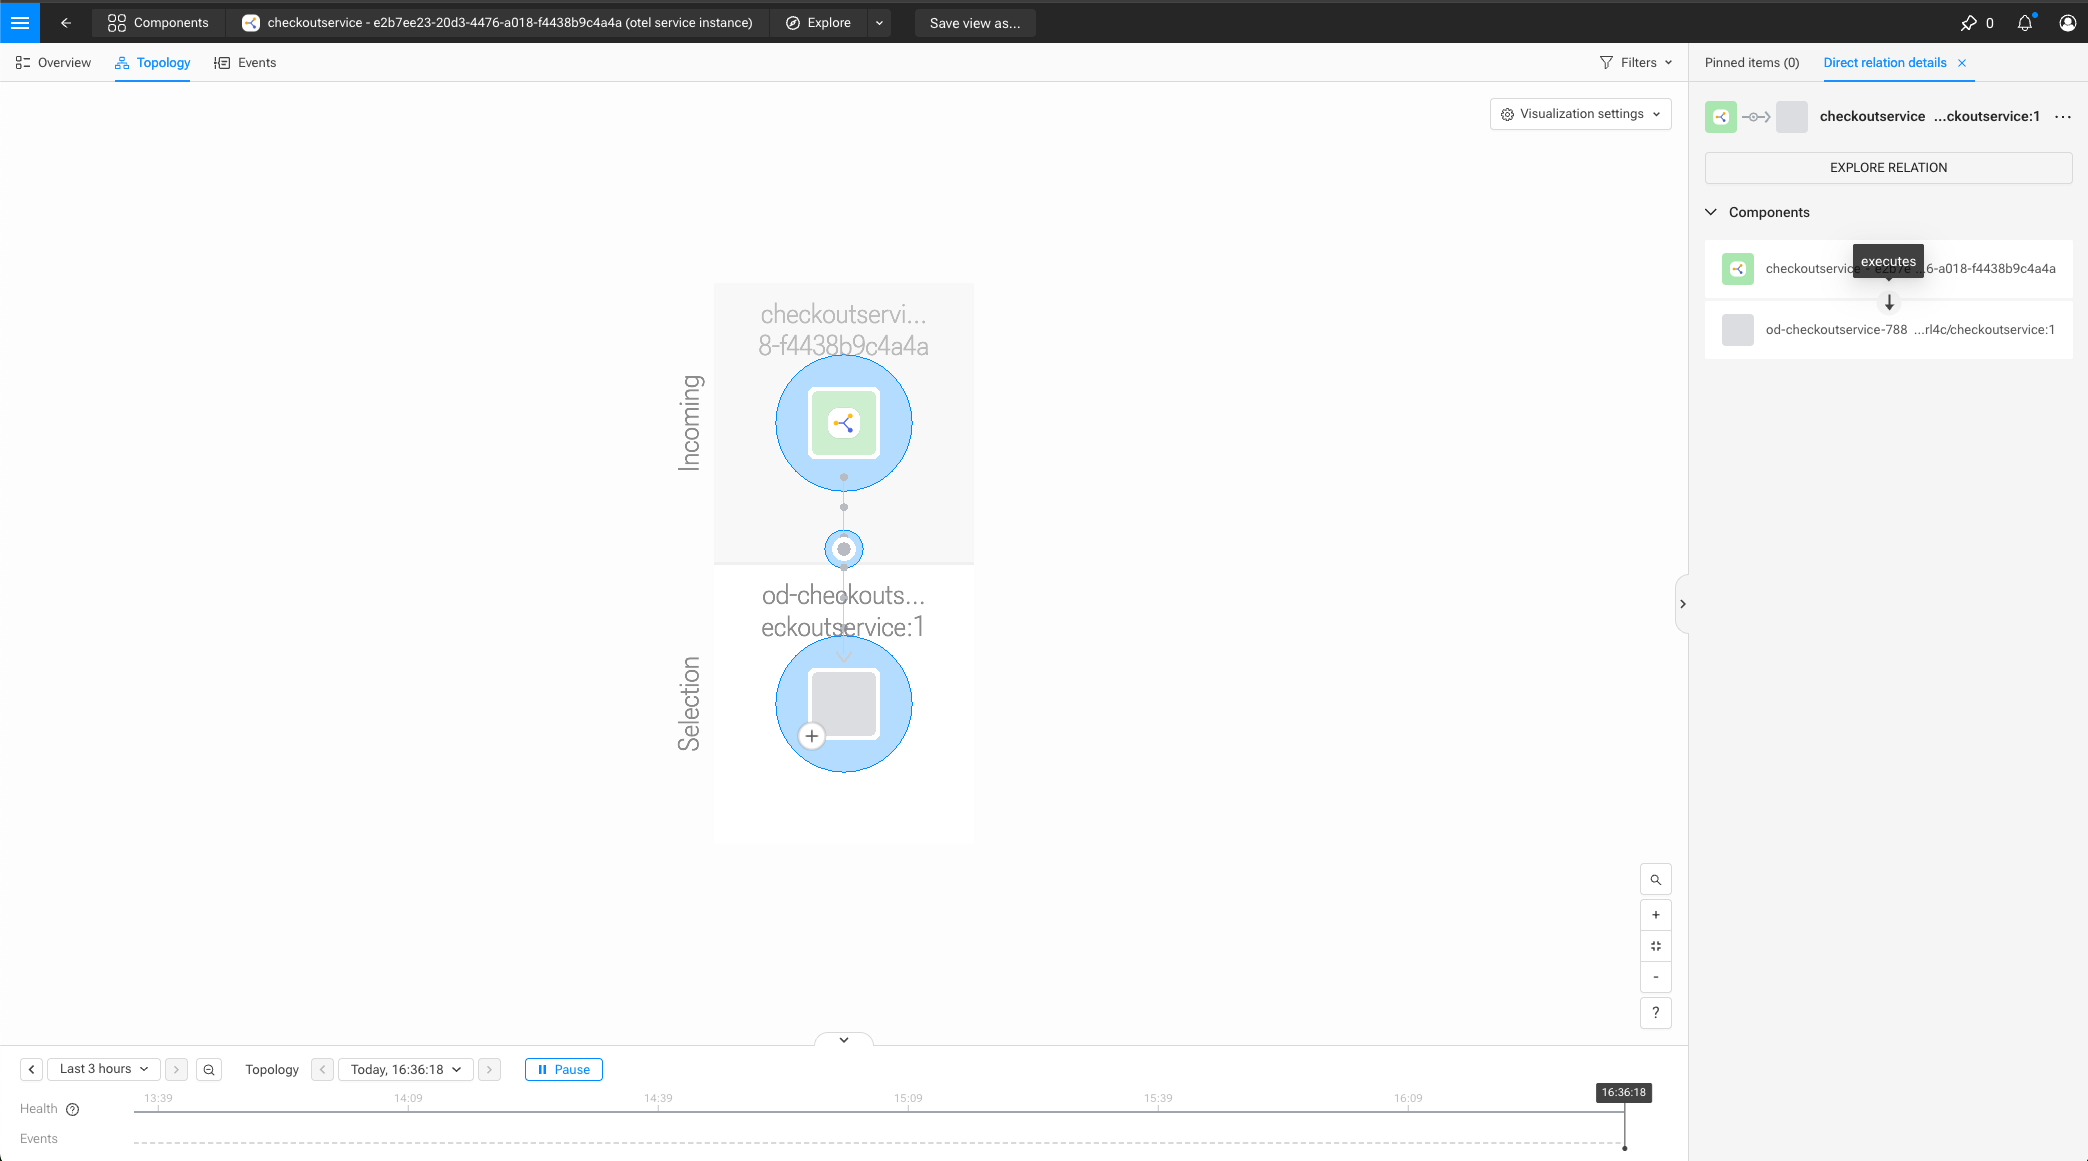
For example, using the checkoutservice from the OTel demo app, visually, the topology should appear as:
checkoutservice (instance) ─> executes ─> checkoutservice (process)
This topology updates continuously as new traces arrive and automatically expires when traffic stops.
View the resulting topology in SUSE® Observability
Use the SUSE® Observability UI to get visual confirmation that the mappings materialize into the expected topology.
-
Open the SUSE® Observability UI at the configured
baseUrlHelm value -
In the left-hand sidebar, click on
Open Telemetry > Services Instances -
Find the
checkoutservicein the list of service instances and click on the service instance name to open the Component Overview/Highlights page -
In the sub navigation-bar at the top, select
Topology -
In the
Outgoinglayer, anod-checkoutservice-<hostId>/checkoutservice:1 (process)node should be visible -
Select the process node, and click
Explore component -
A smaller topology visualizing
checkoutservice → executes → checkoutservice (process)should be visible
See the Troubleshooting guide for tips to debug if the topology is not materializing as expected.
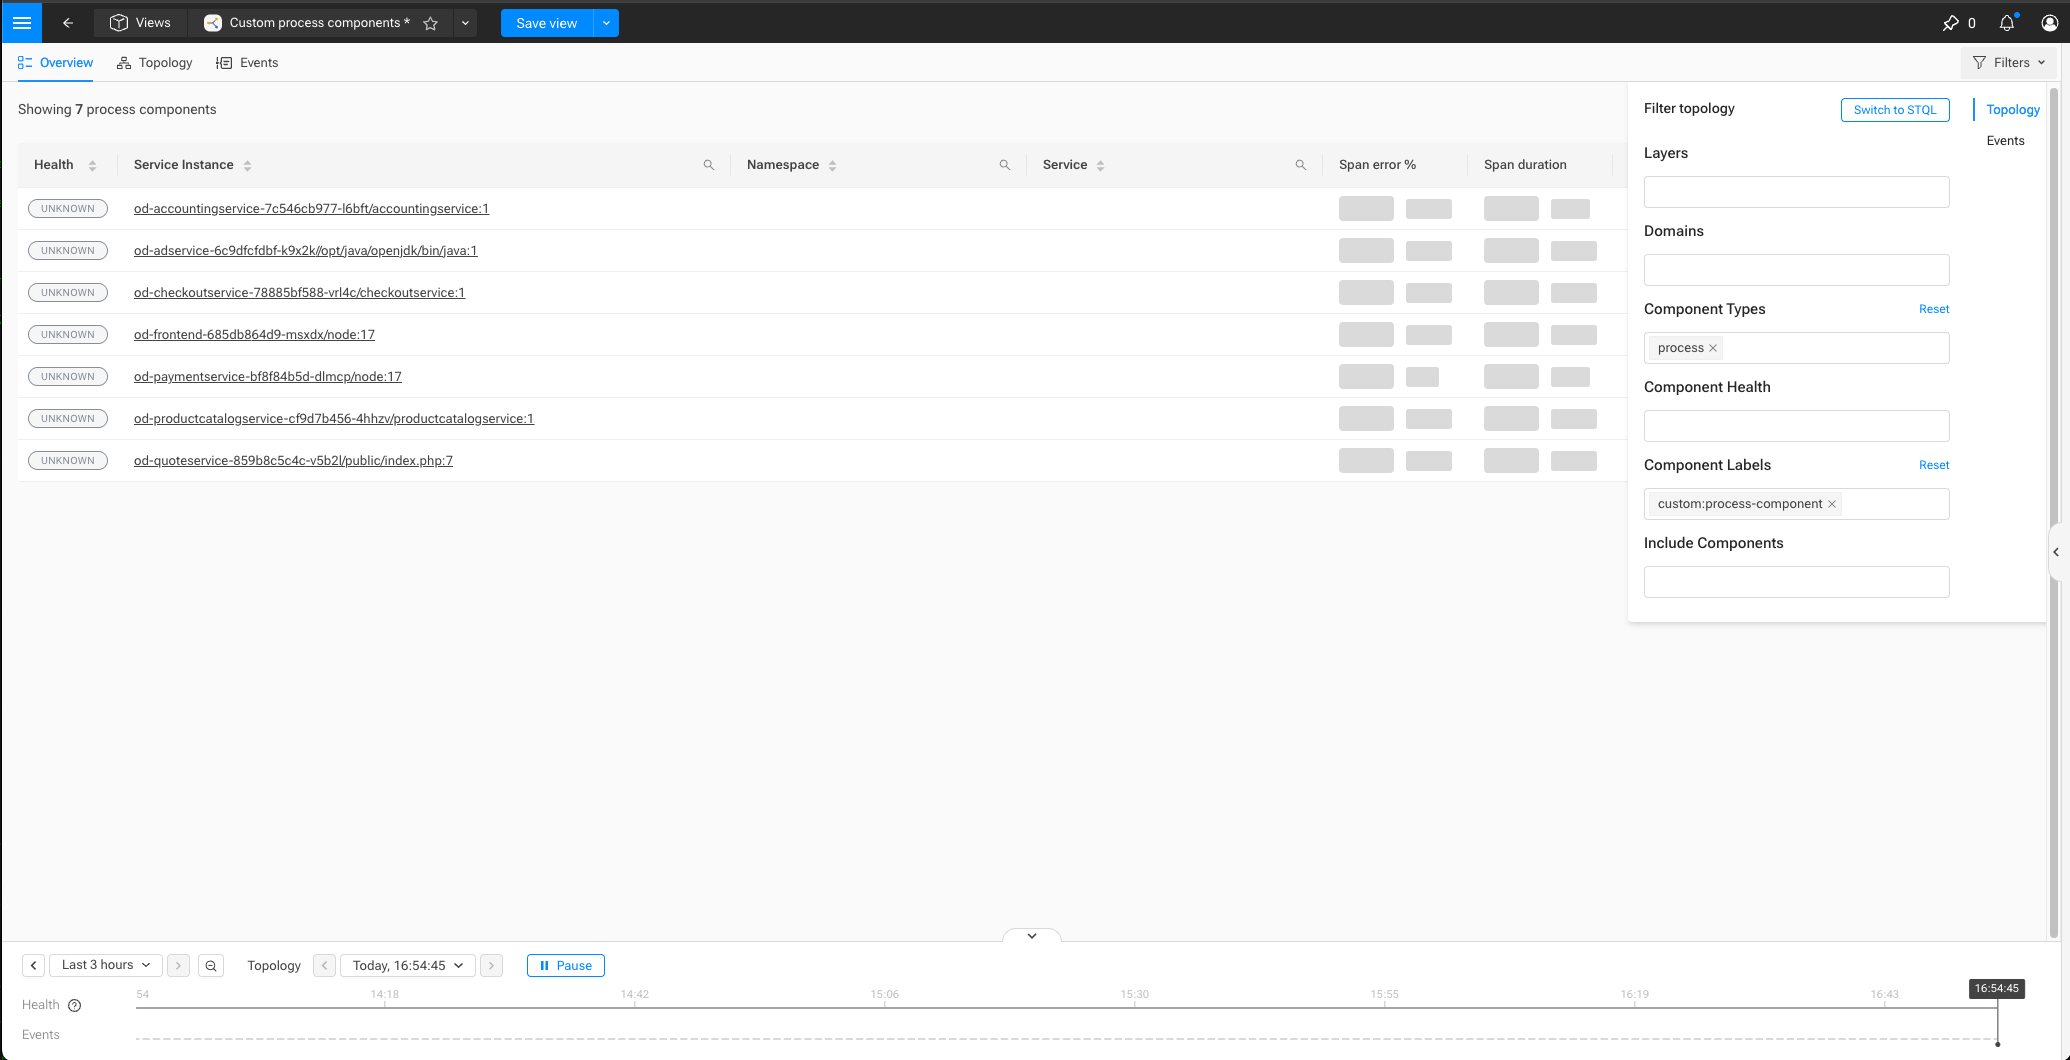
To see all the process components created as a result of the process component mapping being applied:
-
Open the SUSE® Observability UI at the configured
baseUrlHelm value -
In the left-hand sidebar, click on
Open Telemetry > Services Instances -
In the sub navigation-bar at the top, click on
Save view as…and give it a name (e.g.,Custom process components) -
In the left-hand sidebar, click on
Views, and open the view created in step 3 -
In the sub navigation-bar at the top, on the far right, click on
Filters -
Remove
otel service instancefrom theComponent Typesfield, and typeprocess -
Remove
stackpack:opentelemetryfrom theComponent Labelsfield, and typecustom:process-component
Summary
In this guide, you:
-
Built on existing service instance components.
-
Derived process components from OpenTelemetry resource attributes.
Next steps
From here, you can:
-
Attach processes to hosts or containers.
-
Introduce database or messaging relations.
-
Introduce runtime-specific layers (JVM, Go, Node.js).
-
Explore metrics-based service graphs.
-
Extend the StackPack with additional topology layers.
-
Familiarize yourself with an in-depth component and relation mapping reference.